GDELT
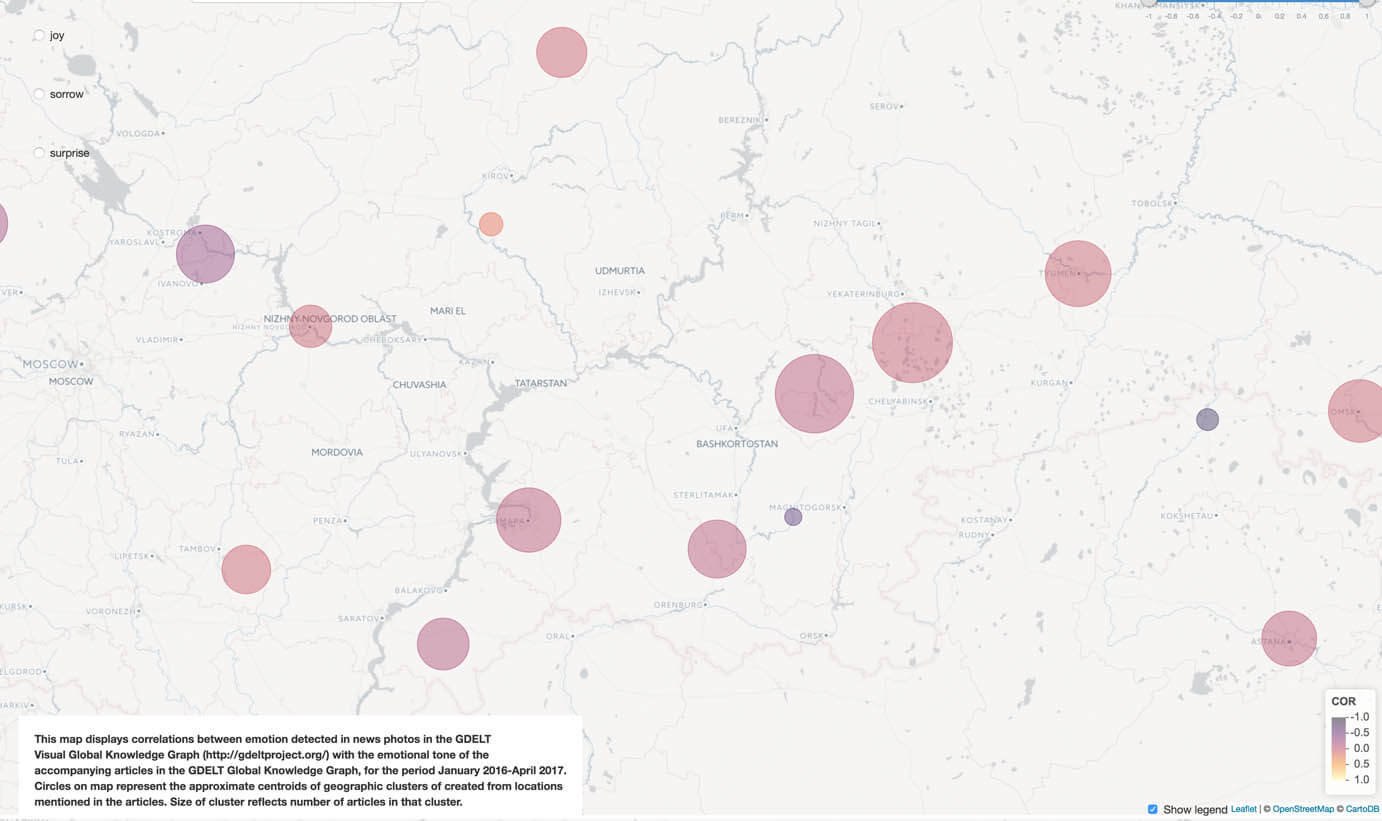
Students formed teams to work with the GDELT Visual Global Knowledge Graph (VGKG) data set to explore the relationship of visual images and related text published in the world's online news media imagery. The VGKG monitors the world's print and web news imagery in over 100 languages and identifies the people, locations, organizations, counts, themes, sources, emotions, images and events driving our global society every second of every day.
The team queried and processed the data set to segment the data by month and geographically cluster records before running a correlation analysis between emotional tone of VGKG article text and the emotions detected in their accompanying photographs. The team created an R Shiny application that mapped the results using Leaflet.JS.
GLOBI
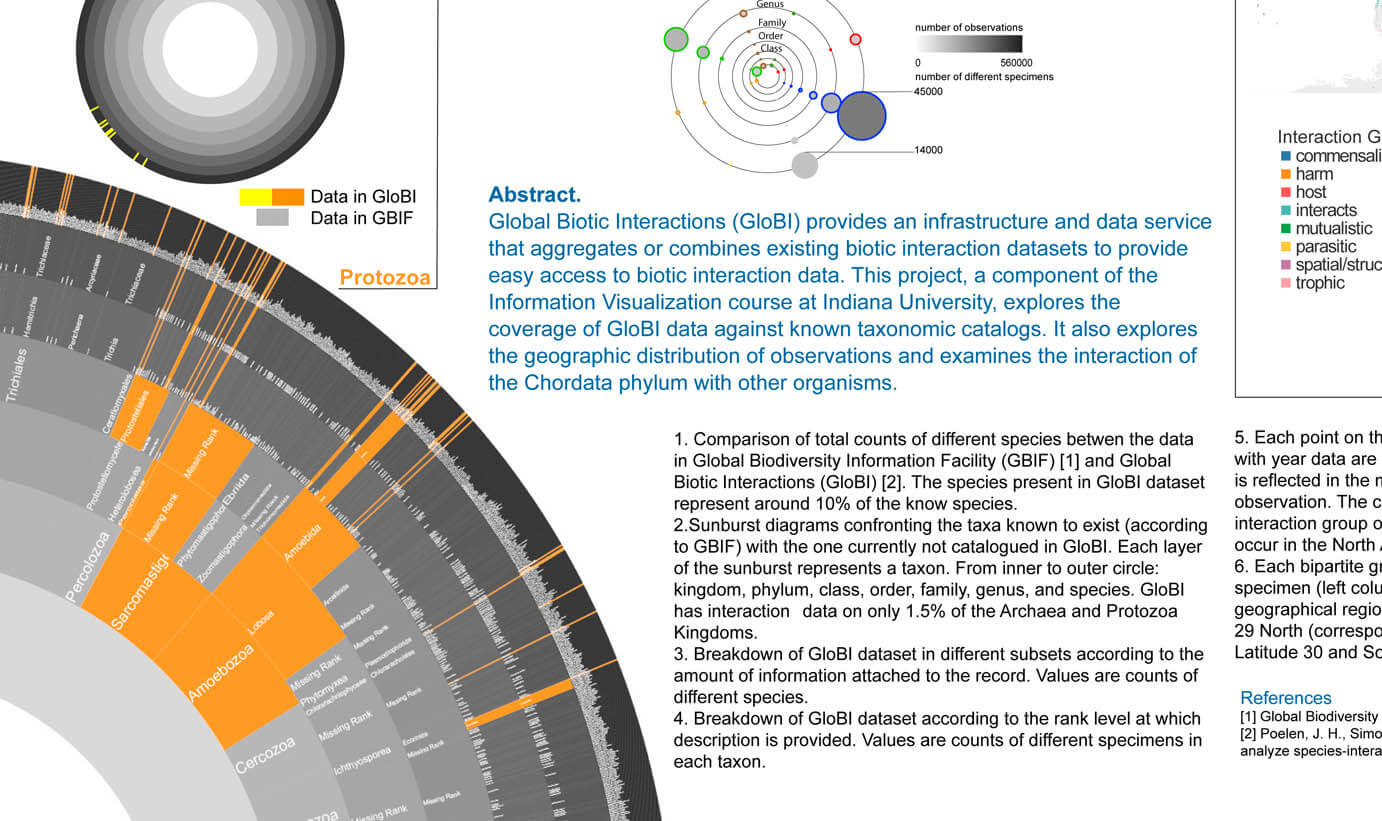
Global Biotic Interactions (GloBI) provides an infrastructure and data service that aggregates and combines existing biotic interaction databases to provide easy access to species interaction data. For this project, the student team explored the coverage (both the geographic and species) of GloBI data against known taxonomic catalogs in order to identify ‘gaps’ in knowledge of species interactions. They examined the GloBI’s datasets to develop a frame of reference for comparison, and explore interaction networks according to geographic regions over time. The team used a combination of Neo4jDB, R statistical software, Sci and Tableau dashboards to analysis and visual the GloBI data set, providing insights that may help to enhance GloBI as a resource for research and education.
Download the Project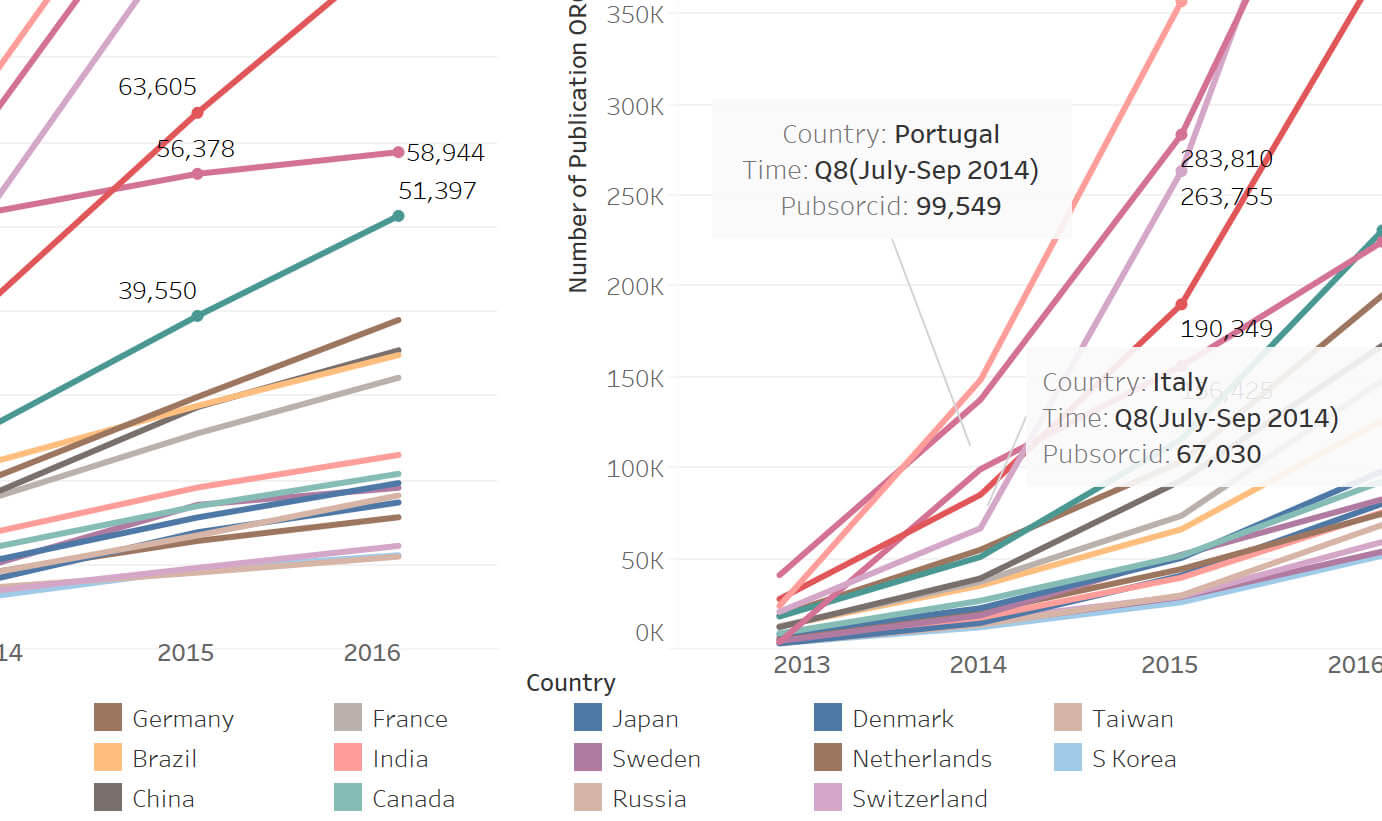
THOR
THOR is a client project with the goal of analyzing the persistent identifier Open Researcher and Contributor ID (ORCID). The student team worked to create visualizations that helped THOR project members understand and act on ORCID data. The visualizations reveal in which disciplines and geographic areas ORCID has become most popular, and between which countries collaborations have become most frequent over the years 2012-2016. Students used Sci2 and implemented a set of Tableau dashboards that will allow THOR to determine where to focus future outreach efforts in the interest of promoting increased use of ORCID identifiers.
Download the Project